

Reports and Dashboards: 7 Things to Decide Before You Build One
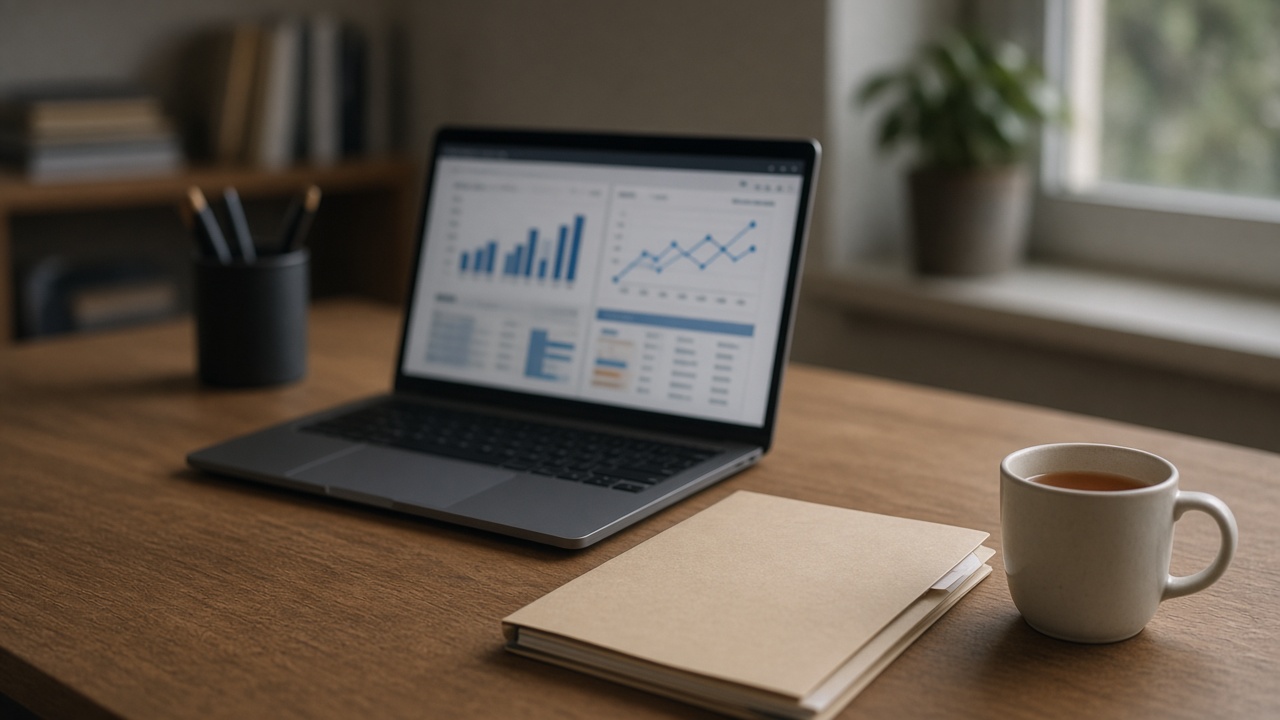
Many Bhutanese organisations already hold useful data in their accounting software, sales records, attendance systems, booking tools and spreadsheets. The trouble is getting a clear picture out of it. Managers wait for someone to copy figures into a report, different departments quote different numbers, and decisions are made on last month’s information. A well-planned dashboard brings the key figures together in one place and keeps them up to date. Here are seven things to decide before you build one.
1. Start with the decisions, not the charts
Ask who will use the dashboard and what they need to decide with it. A director may want a weekly overview of income, costs and outstanding payments, while a branch manager needs daily stock levels or bookings. Write down a short list of questions each user wants answered. Every chart should help answer one of them; anything else is decoration.
2. Agree on what each number means
“Sales”, “active customers” or “attendance” can be counted in several ways. Before any development starts, agree on one definition for each figure, including dates, currencies and what is included or excluded. Writing these definitions down avoids the common situation where the dashboard and the finance report show different totals and nobody trusts either.
3. Find where the data really lives
List every source the dashboard will draw from: accounting or billing software, databases behind your own systems, spreadsheets kept by staff, or devices such as attendance terminals. Check whether each system can export data or connect through an API, and who owns it. Spreadsheets maintained by hand are often the weakest link, so plan how they will be kept consistent or gradually replaced.
4. Clean the data before you display it
Duplicate customer records, missing dates and inconsistent spellings of dzongkhags or product names all lead to misleading charts. A short clean-up of existing records, together with simple rules for entering new data, does more for the quality of a dashboard than any visual design.
5. Decide how often it needs to update
Not every figure needs to be live. Monthly financial summaries can refresh once a day, while stock or service status may need updating every few minutes. Matching the refresh rate to the real need keeps systems simpler, reduces load on your servers and internet connection, and makes the dashboard easier to maintain.
6. Control who can see what
Dashboards often combine sensitive information such as salaries, customer details or financial results. Give each user access only to the figures they need, require proper logins with two-step verification where possible, and avoid sharing dashboards through public links. Keep a record of who has access and review it when staff join, move or leave.
7. Keep it simple and plan for change
A clear page with a handful of well-chosen figures is used far more than a crowded screen full of charts. Start with a small first version, let users try it for a few weeks, and adjust based on what they actually look at. Make sure someone is responsible for keeping data connections working when source systems are updated or replaced.
Talk to eDruk about your reporting
eDruk Private Limited has worked in Bhutan’s ICT sector since 2004, covering software, web and mobile app development, networking and fibre infrastructure, IoT and automation, and technical consultation. If your organisation wants clearer reports from the systems it already uses, we can help you work out what to measure, where the data comes from and how to bring it together safely.
Email edruk@edruk.com.bt, call +975 2 332277, or visit https://www.edruk.com.bt.